Intelligence Dashboards With Knowledge Graphs
D3.js force-directed graphs, three-tier analytics, and correlation intelligence. Fork this to build BI dashboards and strategic intelligence tools.
You're Building BI Dashboards, But...
D3.js force graphs are complex. Building three-tier analytics takes months. Correlation intelligence requires ML expertise.
Building from Scratch
- ✗ Learn D3.js physics engines
- ✗ Debug force-directed layouts
- ✗ Build correlation algorithms
- ✗ Hope performance scales
Tableau/Power BI
- ✗ No knowledge graph views
- ✗ Static chart libraries
- ✗ Can't customize architecture
- ✗ Locked into their ecosystem
Fork Moments
- ✓ D3.js force graphs built-in
- ✓ Three-tier analytics ready
- ✓ Correlation matrix included
- ✓ Fork, customize, ship
Fork This To Build
Analytics Platforms
Executive dashboards, KPI monitoring, trend analysis systems
BI Dashboards
Business intelligence, data visualization, strategic reporting
Knowledge Management
Enterprise wikis, knowledge graphs, relationship mapping
Data Visualization Tools
Interactive charts, network graphs, correlation analysis
Corporate Intelligence
Market intelligence, competitive analysis, strategic insights
Strategic Planning Tools
Decision support, scenario analysis, strategic mapping
Market Research Platforms
Industry analysis, market sizing, trend detection
Competitive Analysis Systems
Competitor tracking, market positioning, strategic moves
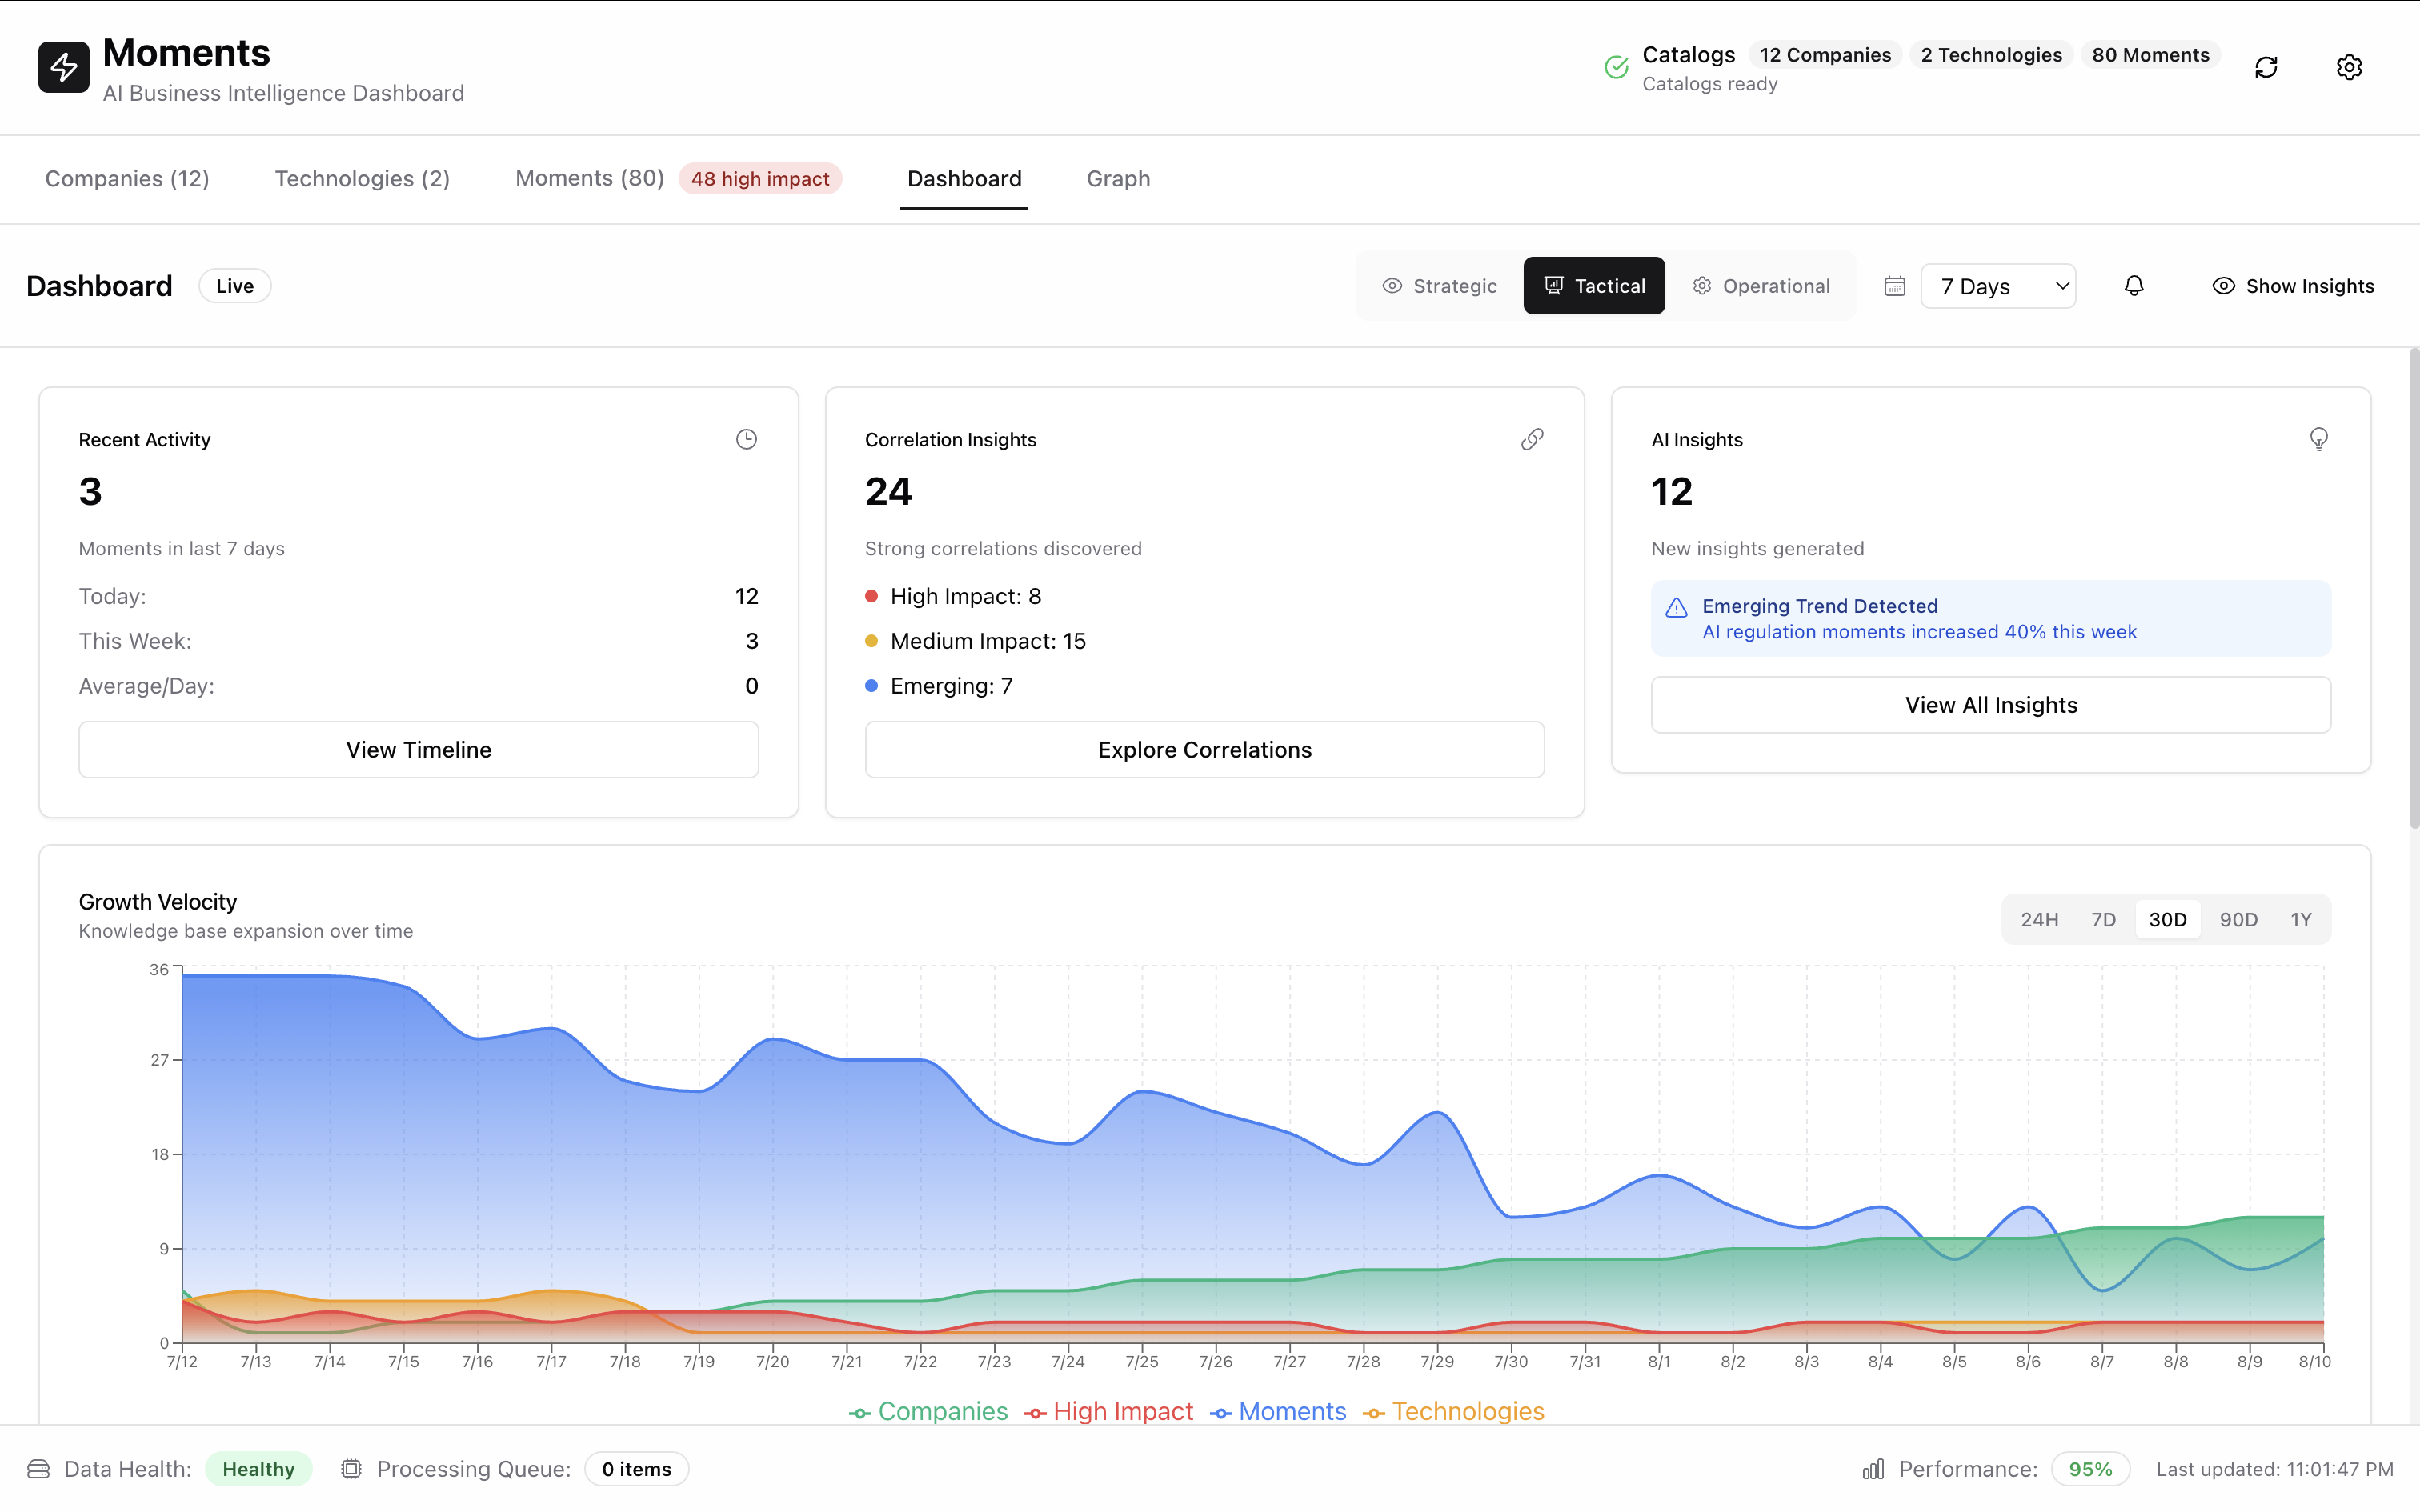
Three-Tier Analytics Architecture
Strategic Tier
Executive-level KPIs and trend summaries for strategic decision-making.
- Growth velocity charts
- Real-time KPI monitoring
- High-impact event tracking
- Multi-temporal analysis
Tactical Tier
Correlation intelligence for analysts discovering hidden patterns.
- 24+ strong correlations
- Impact classification
- AI-powered pattern discovery
- Emerging trend detection
Operational Tier
Real-time data access and filtering for day-to-day operations.
- Interactive filtering
- Advanced search
- Real-time updates
- Granular data access
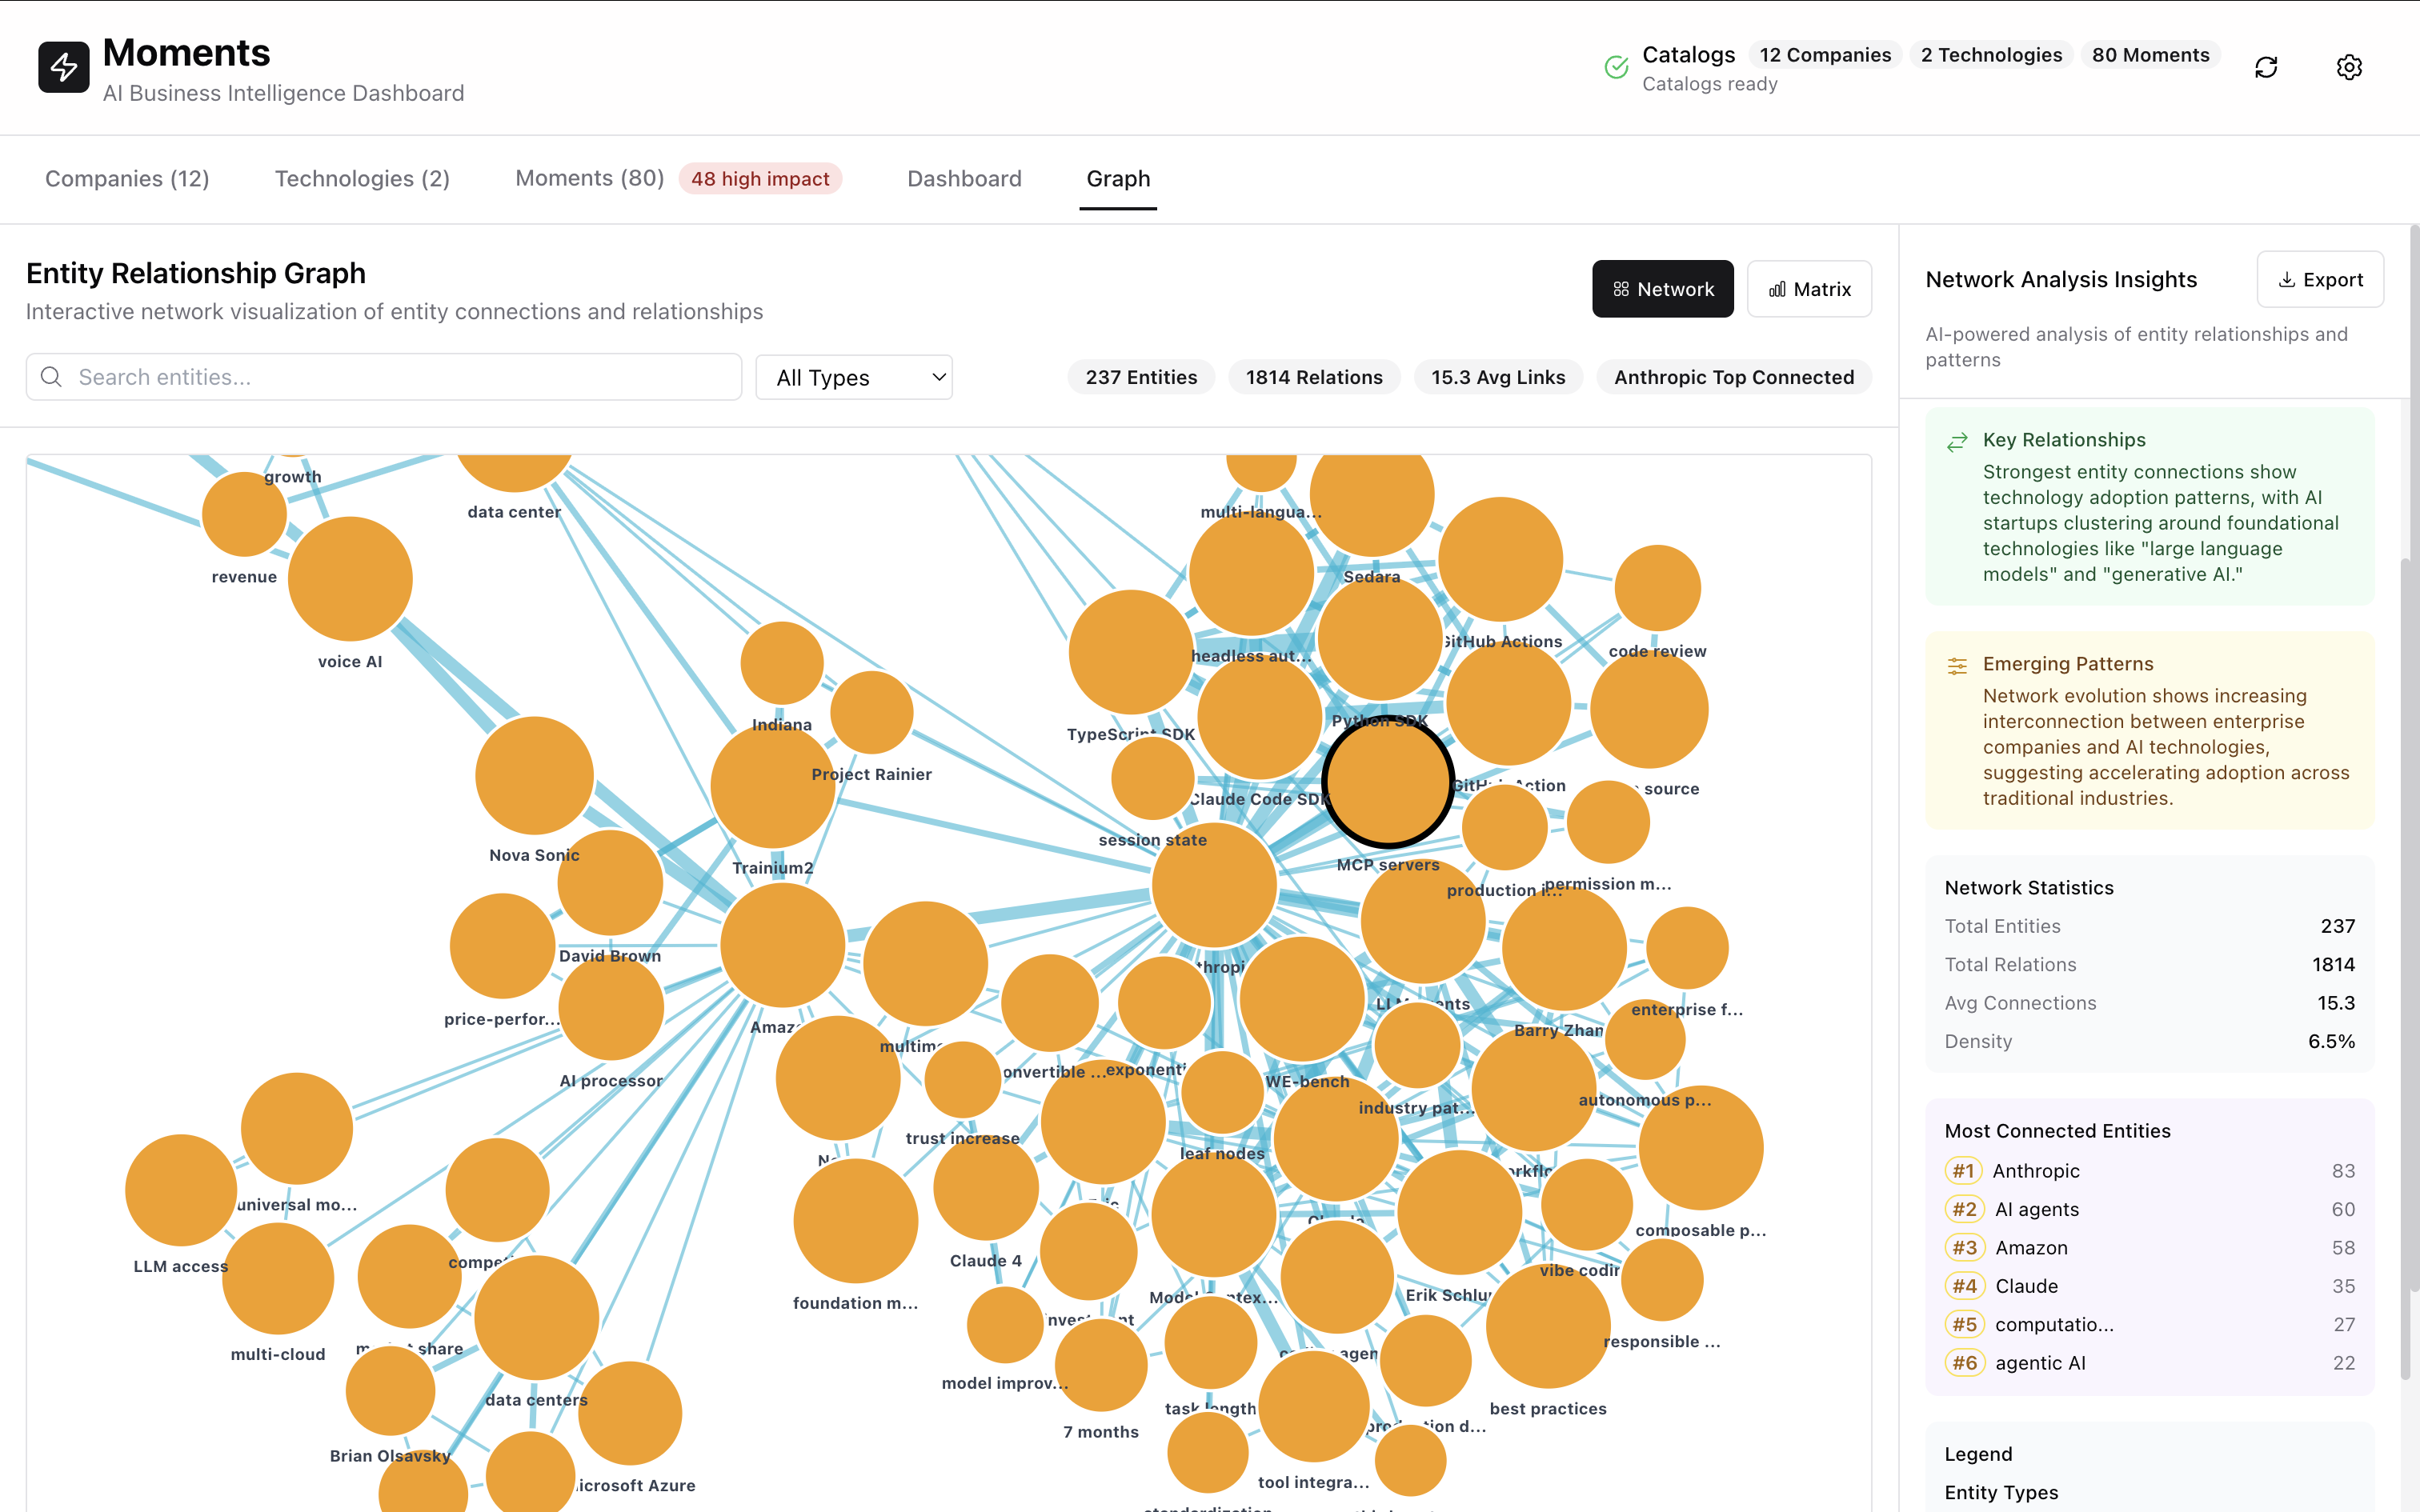
Interactive Knowledge Graphs
Visualize complex relationships through force-directed network graphs. 237+ entities and 1,814 relationships dynamically rendered for exploration.
-
Force-Directed Layouts
Physics-based visualization automatically organizes nodes by relationship strength
-
Multi-Dimensional Filtering
Filter by entity type, relationship strength, and temporal dimensions
-
Real-Time Interactions
Click nodes to reveal connections, zoom to explore clusters, drag to rearrange
Correlation Intelligence
Correlation Matrix Analysis
Discover hidden patterns across 80+ pivotal moments with machine learning algorithms.
Factor Analytics
Sunburst visualization reveals factor contributions and hierarchical relationships.
- • Multi-level factor decomposition
- • Interactive drill-down capabilities
- • Hierarchical data representation
- • Visual impact assessment
- • Comparative factor analysis
Getting Started
Deploy Your Dashboard
1. Clone Repository
2. Install Dependencies
npm install
3. Configure Data Sources
Set up your data connections in config.js
4. Start Development Server
Customization
Moments is designed to be adapted to your domain. The reference implementation uses AI industry data, but you can plug in any entity-relationship data source.
Frequently Asked Questions
What is Moments?
Moments is an AI business intelligence dashboard that visualizes complex data relationships through interactive knowledge graphs. It features 237+ entities, 1,814 relationships, and three-tier analytics for strategic, tactical, and operational insights.
What are the three analytics tiers?
Strategic tier provides executive-level KPIs and trends. Tactical tier offers correlation intelligence for analysts with 24+ strong correlations. Operational tier delivers real-time data access and filtering for day-to-day operations.
How does the knowledge graph work?
The knowledge graph uses force-directed network visualization to map 237+ entities and 1,814 relationships. Interactive nodes reveal connections, patterns, and insights. You can filter by entity type, relationship strength, and temporal dimensions.
Is Moments free?
Yes, Moments is completely free and source available under the BSL-1.1 license. You can self-host it on your own infrastructure or deploy to cloud platforms. No licensing fees or subscriptions required.
What data can I visualize?
Moments is designed for AI industry intelligence but can be adapted to any domain with entity-relationship data. The reference implementation includes company data, technology trends, strategic moments, and market analysis.
Learn More About Moments
Three-Tier Analytics Architecture
Transform AI industry data into strategic insights with Moments three-tier analytics dashboard featuring real-time KPIs, correlation intelligence, and factor analysis across strategic, tactical, and operational levels.
Read the full article Interactive Knowledge Graph Visualization
Discover hidden connections in the AI ecosystem through force-directed network visualization with 237+ entities and 1,814 relationships, revealing strategic patterns and market dynamics.
Read the full articleBuild Intelligence Dashboards That Scale
Fork Moments and ship BI platforms, analytics dashboards, or knowledge management tools in days. D3.js graphs, three-tier architecture, battle-tested.